Thank you! Your submission has been received!
Oops! Something went wrong while submitting the form. Please try again.
  • Take food and beverage inventory 5x faster

  • Scan invoices and update COGS instantly

  • Save time and decrease waste with ordering and receiving

  • Create a profitable menu with recipe management

See for yourself! Fill the form to schedule a free demo customized to your restaurant needs, or give us a call at 1-786-692-8627
John Smith
Hilton Anatole

Barcode scanning and multiple phones can do inventory at the same time and it's updated live.

Brenda Maurio
Señor Frogs Bahamas

We love WISK. Maria Ferris is the best, also Angelo and Luisa. Thank you so much for your support.

Joel Hampton
Aquaduck

I could see, like, down to the bottle what I'm losing. That's all I've wanted the whole time.

Damir
Hook & Reel

You guys, I mean dream come true.

Run a more profitable bar with smarter inventory and cost tracking

  • Take food and beverage inventory 5x faster

  • Scan invoices and update COGS instantly

  • Save time and decrease waste with ordering and receiving

  • Create a profitable menu with recipe management

See for yourself! Fill the form to schedule a free demo customized to your restaurant needs, or give us a call at 1-786-692-8627
John Smith
Hilton Anatole

"You guys, I mean dream come true."

Joel Hampton
Aquaduck

"I could see, like, down to the bottle what I'm losing. That's all I've wanted the whole time."

Brenda Maurio
Señor Frogs Bahamas

"We love WISK. Maria Ferris is the best, also Angelo and Luisa. Thank you so much for your support."

Damir
Hook & Reel

"Barcode scanning and multiple phones can do inventory at the same time and it's updated live."

What Operators Reveal About WISK Results

An image with the WISK logo at the top. Below the logo, a yellow text box contains the words: "What's harder than closing at 3am? Doing inventory after. A local nightclub found the fix. It's WISK."  The main part of the image is a graph titled "Inventory Time" on a dark background. The y-axis shows time in increments from "0h : 0m" to "2h : 5m." The x-axis shows dates from "Jul 21" to "Aug 24." A blue line graph plots inventory duration over time, showing fairly consistent times around the 1 hour 40 minute mark, with a slight dip around August 17th. A tooltip hovers over a data point on "August 11, 202X, 8:04AM" displaying "Inventory Duration" and "1 hour : 35 minutes."

Turn Inventory Into a Simple One-Hour Task

Inventory after closing doesn’t need to steal hours of your night. WISK cuts the process in half and gives you instant, reliable numbers.

Book a demo here

Trust Your Inventory Numbers Every Time

Inventory after closing doesn’t need to steal hours of your night. WISK cuts the process in half and gives you instant, reliable numbers.

Book a call
At the top, a yellow text box reads: "Straight from WISK's dashboard: Cocktail bar in Old Montreal tracks bottles faster than ever."  Below, a central graphic displays two large percentage figures on purple and blue backgrounds, surrounded by irregular red shapes:  The top purple box shows "23.33%" and is labeled "Theoretical Cost (%)."  The bottom blue box shows "25.02%" and is labeled "Actual Cost (%)." A dropdown menu at the very top indicates an "Inventory range" from "Aug 10, 2025 - Aug 27, 2025."  At the bottom of the image, black text reads: "Manual counts meant wasted time and inaccurate bottles. Now, they get instant, 99% accurate reports." The "99% accurate reports" part is highlighted in a yellow box.
An image displaying the WISK logo at the top. Below the logo, a yellow text box contains the message: "Real data from a local family-owned bar in Key West! Every ounce accounted for — 99.8% match."  The main part of the image is a line graph titled "Actual vs Theoretical Cost." The y-axis ranges from 0 to 120 (presumably percentages), and the x-axis shows dates from "Jun 7" to "Aug 18." Two lines are plotted: a red line representing "Actual Cost" and a blue line representing "Theoretical Cost." The lines generally track closely, with some slight variations. A tooltip is shown hovering over a data point on "Monday, 4 Aug, 09:03:34" which reads: "Actual Cost: 13.97%" and "Theoretical Cost: 12.91%."

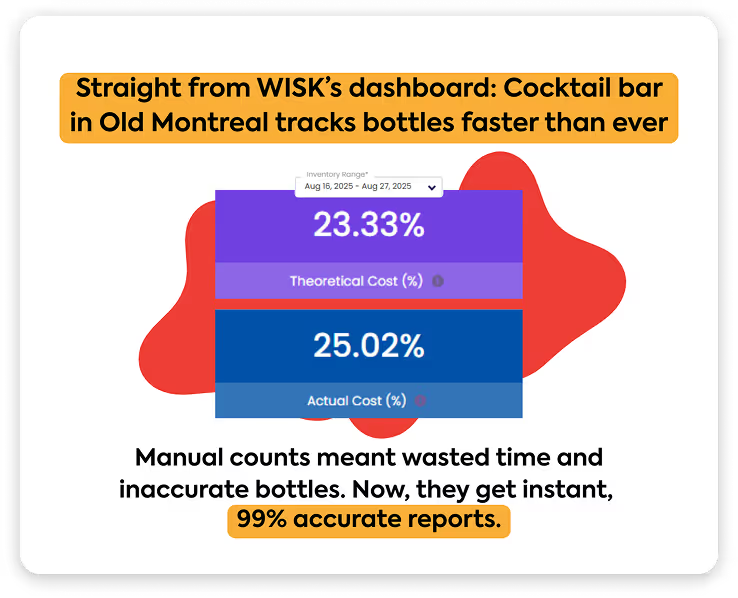
Accuracy You Can Trust in Every Report

Manual tracking leaves too much room for error. WISK replaces the guesswork with near-perfect accuracy — giving you instant reports you can trust every time

Book a demo here